Outside Economics

Investment Portfolio Performance

Posted by Wendell Brock, MBA, ChFC on Thu, Feb 05, 2015

Everyone envisions great performance within their investment portfolio. Performance is one of the most sought after characteristics of any portfolio. However, evaluating the return only ignores risk and several other factors that affect performance.

Achieving a balance between the risk and performance or return is what a balanced investment portfolio is all about. In a balanced portfolio the stocks generally provide the greater return and the bonds are there to help minimize the overall risk; risk management techniques are important to consider, providing a balance between two distinct asset classes, stocks and bonds.

These two major asset classes are often broken down between many other asset classes. For example, bonds may be divided between US Treasuries, US corporate bonds, international bonds, inflation protected bonds, junk bonds, municipal bonds, etc. Stocks are likewise divided; there are the large cap, mid cap and small cap, international stocks, real estate stocks, retail stocks, commodity stocks, natural resource stocks, utilities, etc.

Risk is also broken down, as there are several types of risk that each stock and asset class are subject to. There are four major types of risk: technical risk, fundamental risk, interest-rate risk and inflation risk. Each of these risks can play a significant role in a stock or bond’s performance. All publicly traded stocks are subject to technical risk (a.k.a. macro or market risk). Many simply rise and fall with the market as a whole. While fundamental risk, (business or default risk) deals primarily with the company itself; is the management team running things right? Default risk can come into play if the company gets in such a spot that it needs to file bankruptcy; such is the recent case for Radio Shack.

So here are a few things to watch when evaluating performance…

Don’t forecast.

Many folks have a wonderful year in the market and then think all the succeeding years will be the same and they expect the same. They figure that they will hit a jackpot in 10 or 20 years based on what their account did last year after all it should continue to perform at the same level in the future, right? Just like farming, farmers have seldom perfect farming weather year after year. Some years there is a drought and others flooding!

Don’t work off averages

An average return only tells us if the fund has been positive or negative over a period of time is all. Each year is a story to itself; long-term averages don’t always tell the whole story, the average will hide down years. If a portfolio goes up from $10,000 to $11,000 great we had a 10 percent gain. However, if the account goes down by 20% it will take 25% to get back to break even. This is the math of losses, which often plays a major role in the emotional choices to sell at the bottom or get out when things are not looking “great”.7Twelve_1

Keep a multi-year perspective

“Maintaining a multi-year perspective is vital to the mental and emotional health of an investor. Year-to-year returns are ‘noisy’ whereas 3-year rolling returns are more indicative of general performance patterns.”[1] One year’s return may not provide an accurate image of an entire portfolio model and may limit the investor’s vision.

While this may sound counter to the previous paragraph; it is not. The previous paragraph about averages is meant to keep the average return in perspective with the annual return. This section provides the reasoning to keep a long-term investment perspective; stick with the game plan for the long-term giving it time to work on your behalf. One year is not a sufficient amount of time to let a long-term portfolio model strategy work.

Expect Losses

According to Dalbar investors earned less than ½ the rate of return over the past 30 years that the market earned. Again, money is emotional, it is not math. This lack of return is due in part to investors pulling money out at inopportune times; the market is down, need college funds, down payment for a house, and other major unexpected expenses. The biggest looser is fear when the market tanks.

Yes it is wise to minimize losses, hence a properly balanced portfolio, but the best thing to do is have a game plan for when the market reverses. Ask that question now and make a plan. Are you going to hold on? Sell when the market is down by X% and get back in when? What if the market drops to your target sell level, we sell, and then it does not continue down, but reverses the next day and shoots back up! These bounces are devastating to portfolios; create a logical plan and agree on the plan with your advisor. The old adage of: “Buy low and sell high” might be part of your plan, when the market drops, should you buy more instead of selling?

Two Parts to Climbing a Mountain

If a person is not retired, then they ought to keep adding to their investment/retirement accounts, this will help immensely. (Many folks switch jobs and rollover their 401K to an IRA and let it sit never adding another nickel! To the extent possible keep adding.) This part of mountain climbing referred to as ascending, and when referring to investing, it is accumulating. Going up the mountain is typically easier, and less stressful on the body. Be an accumulator of assets and shares.

On the other hand, if a person is retired, then they are heading back down the mountain, descending or de-accumulating. It is always more trick getting down the mountain than up, for one it is much harder on the knees! There are far more accidents going down a mountain than up. It uses different tools and techniques; in this phase having some market exposure is good, but a person will want to develop greater security in their payouts too. Similar to having a sure footing with every step down.

Check emotions, make a plan for when the market does go down, and manage risk in a balanced portfolio and things should go alright. Most important keep a positive outlook, ask questions, do not be mean and nasty with advisors – they really do want to see investment accounts go up and up! Most advisors I know stress and lose sleep over client’s accounts and their performance.


[1] Craig L. Israelson, PhD. Architect of the 7Twelve Portfolio Model, Professor of Financial Planning at Utah Valley University (UVU).

Topics: retirement, Investment Portfolio, Investment, Risk Management

A Make Sense Investment Portfolio Strategy

Posted by Wendell Brock, MBA, ChFC on Wed, May 21, 2014

There are many theories on creating the best investment portfolio. Here is one that is well balanced, and well suited to surviving the financial fluctuations of these times. It is called the 7Twelve® portfolio. It was first formulated by Craig L. Isrealsen,PhD. an Executive-in-Residence in the Financial Planning Program in the Woodbury School of Business at Utah Valley University. Overall, he has over 25 years of experience in the financial industry.

Professor Isrealsen created this approach to maximize the benefits a diverse portfolio can offer. He likens this approach to a good salsa recipe. “The broad diversification of the 7Twelve® model is more important to its performance than picking the “right” funds. Very simply, the recipe is more important than the ingredients.”

Good ingredients + poor recipe = poor salsa/poor portfolio results

Good ingredients + good recipe = good salsa/good portfolio results

A 7Twelve® portfolio includes 7 core asset classes and consists of twelve different ETF’s or mutual funds (funds). Each of the twelve funds are equally weighted and the portfolio is periodically rebalanced to maintain an equally weighted structure.

Some of the benefits and objectives of the 7Twelve® portfolio include being able to produce long-term equity-like results with less volatility than equities. Compared to equities, this approach minimizes the frequency and the magnitude of losses thus delivering a more consistent performance over a rolling 3-year period of time. Maintaining a consistent portfolio with a philosophy of broad diversification will also help investors avoid fads and performance chasing.      

When assembling a balanced portfolio often its key elements are equities and fixed income assets. The seven core asset groups with their twelve associated funds are: US equity: large-cap US, mid-cap US, and small-cap US; Non-US equity: Non- US developed, and Non-US emerging market; Real Estate: global real estate; Resources: natural resources, and commodities; US bonds: aggregate US bonds, and inflation protected US bonds (TIPS); Non- US bonds: international bonds; and Cash: US money market.7Twelve 1

This arrangement will allocate 8 equity and diversifying funds- which is 65% of the overall portfolio, and 4 fixed income funds- which accounts for 35% of the portfolio. A 65/35 allocation balance will bring together more stability and less risk in a solid combination that, over the long haul, has a proven track record toward steady growth even in volatile times, such as we are experiencing now.

Each of the 12 funds is equally weighted at 8.33% of the portfolio. The equal-weighing is maintained by periodically re-balancing each of the 12 funds back to an 8.33% allocation. Quarterly or annual re-balancing generally produces the best performance, whereas monthly re-balancing is too frequent.

Re-balancing is an important part of the 7Twelve® investment strategy. Re-balancing helps to accomplish the goal of buy low and sell high. As sectors grow some is sold off to bring the portfolio into balance; the other sectors that are performing poorly get some new money to bring them up to the balanced amount. Nearly all sectors take their day in the sunshine, that of being the best performing asset. By keeping the portfolio balanced, each one is ready for their day to shine.

Re-balancing can also be done by simply adding new money to funds to re-create the 8.33% balance; or, if one is in their retirement years to simply withdraw money from the best performers whereby restoring the 8.33% balance.

Let’s face it, we are emotional creatures by nature, and most investors too are emotional about the decisions to buy or sell. Re-balancing is a fantastic tool that may help with the emotional roller coaster. Using systematic guidelines to monitor the portfolio increases the chance for success. Any assistance with the emotionally charged buy/sell decisions that may chip away at an investors overall gains is helpful. Trying to outsmart the market tends to do more harm than good; nobody can beat randomness at any given time. Having a steady plan to follow will help the investor to safely navigate the years it takes to grow their investment.

One of the main challenges of encouraging an investor to build a multi-asset portfolio is that the portfolio will never outperform the best performing individual asset class in any given year. Multi-asset portfolios are steady, not flashy. Nervous investors who are constantly looking over their shoulder may feel the need to chase last year’s best performing asset class and invest some or all of their portfolio into them. However, the winner last year is typically not the winner this year. This type of roller-coaster investing will surely lead to disaster.

Building a diversified portfolio is the only logical investment philosophy—both emotionally and mathematically. The emotional swings caused by chasing the performance of individual asset classes should be obvious, but the mathematics may not be.

The mathematical evidence supporting the wisdom of a steady multi-asset portfolio vs. performance chasing is simply put: asset classes that have huge gains also tend to also have large losses in subsequent years—and the math of gains and losses is NOT equal. For instance, a 50% loss requires a 100% gain to get back to the starting point.

Therefore, avoiding large losses is one of the key reasons for building a broadly diversified portfolio. Individual asset classes have great years (such as US stocks in 2013) but next year may not produce similar results. A steady, well diversified portfolio will win in the end. 

The 7Twelve® portfolio recipe for investing has a proven track record and is well worth looking into if you haven't already. Give us a call if you think this portfolio model will help you, and as always, do your own homework before you decide to invest.

______________

7Twelve is a registered Trade Mark by Craig Israelsen and is used by Wendell Brock by a licensing agreement.

Topics: 7Twelve, Investment Portfolio, asset classes, equities, Fixed Income, Craig Israelsen

The Markets - What's Next?

Posted by Wendell Brock, MBA, ChFC on Thu, Nov 21, 2013

Following the markets are a challenge pure and simple. It is always interesting to me how people predict the future. In this case it is a prediction based on history; if something is moving in one direction then chances are it will continue for a while in the same direction, with the caveat that it could change direction at any point in time, thus covering the prediction.

The idea of predicting never set well with me so, as an active Boy Scout, my feeling is to simply “Be Prepared”. That seems to be the better road to travel, do all you can to be prepared and let the chips fall where they may. It may be even less stressful to be prepared then to predict.

I remember listening to a stock picker once telling the audience that they only hoped to be right 51% of the time, if so they had a profitable year. I will gladly stick with a core portfolio design, with a little left over for exploring if the client wants to explore a little to try and find the 51%. Hence, the term “core and explore”.

Having a core portfolio as the foundation of the investment portfolio is a more conservative investment strategy, which then allows for greater risk in other areas. It is with the core portfolio that success can be achieved over time. Nothing in a core portfolio happens short-term, patience is required.

Barbara Kollmeyer did a great job reporting on Goldman’s predictions for next year, so I am presenting her article in full for you to read below. I am interested to see how close Goldman comes next year. It will be a very dicey year, with more of Obamacare coming into full effect, more Dodd Frank being implemented, and other regulations that are geared to choke business a little more. 

Goldman: S&P 500 could drop 10% sometime during 2014
November 21, 2013, 5:00 AM

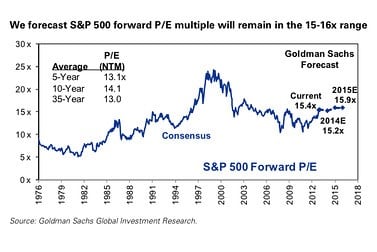
S&P 500 Forward Graph

Goldman Sachs has released its its top ten market themes for 2014. It’s calling for U.S. growth to accelerate to 3% and another “solid year” for equities, notably in developed markets, with some caveats of course.

In a separate note released Wednesday, Goldman’s David Kostin and other strategist laid out their S&P 500 SPX +0.31% forecasts for next year, reiterating an end-2014 target of 1,900, a gain of 6% — its fair value estimate. (Note, that’s a little more sunshiny than that 12-month S&P target of 1,840 from Morgan Stanley, aka Bob Marley.)

Here are the caveats though. Goldman says given the big run in the S&P 500 — some 26% year-to-date — the index could fall 6% in the next three months and 11% over the next 12 months, to levels of 1,700 and 1,600, respectively. And the investment banks sees a 67% probability of a 10% drop at some point in 2014.

While multiple expansion was the name of the game for stocks in 2013, next year’s returns will depend on earnings and money flow rather than further valuation re-rating, says Goldman. And valuation is the biggest wildcard. Goldman says its year-end 2014 price target reflects a slight multiple contraction to a p/e of 15.2 forward EPS.

Durability of the expansion matters, says Goldman, and if above-trend growth continues past 2014, the output gap will narrow and the cost of equity will fall, with both trends supporting a higher P/E multiple. Goldman sees forward P/E for the S&P 500 of 16 times, with the index reaching 2,100 by the end of 2015 and 2,200 by the end of 2016.

So where to go with all that? Here is Goldman’s four recommended strategies for next year:
1.     Growth over value. Russell 1000 Growth  RUI -0.36% should beat Russell 1000 Value as slowing earnings growth, falling equity risk premium and higher bond yields will benefit growth.
2.     Firms investing in capital expenditure. Companies that have under-invested in recent years, but have high return on invested capital that Goldman thinks will spend more in 2014 should create a platform for future growth.
3.     Companies with high buyback yields. Goldman’s sector-neutral basket of 50 stocks with the highest share-repurchase yield should benefit as firms return more cash to shareholders.
4.     Stocks with high operating leverage. Economic growth will boost sales and firms with a high degree of operating leverage will benefit most in terms of a lift to EPS.

As for sectors, Goldman is re-shuffling its pro-cyclical sector allocation, recommending overweights in IT, consumer discretionary, industrials vs. underweights in consumer staples, utilities and telecom services. Financials, materials, energy and health care are market weights.

Here’s more tidbits from Goldman’s crystal ball on the S&P 500:
1.     Operating EPS forecasts for the S&P: $108/2013, $116/2014, $125/2015, $132/2016, $138/2017. Technology will generate 40% of S&P 500 EPS in 2014.
2.     Revenue forecast for the S&P : Up 5% in both 2014 and 2015, in-line with consensus. Every 100 basis point shift in 2014 U.S. GDP translates into a swing of roughly $5 per share in 2014 EPS.
3.     Margins: Will return to the previous high of 8.9% in 2014, 9% in 2015. Goldman says its profit-margin forecast is the “greatest investable gap relative to consensus expectations.” Bottom-up consensus sees margins establishing a record high of 9.5% in 2014 and 10.1% in 2015. Every 50 basis point swing in net margins equals around $5 per share shift in 2014 EPS.

And show me the money?
1.     $150 billion to flow into U.S. stocks in 2014, from individuals, investors and companies.
2.     Net household outflows will total $430 billion next year as direct ownership of stocks falls, but $130 billion is expected to flow into ETFs next year.
3.     Net equity inflows of $225 billion from mutual, pension funds and life insurers.
4.     International investment outflows of $25 billion, following on from what was seen in 2013. U.S. investors are expected to buy $200 billion of non-U.S. stocks during 2014.
5.     Total capital usage by S&P 500 firms will rise 18% to $2.2 trillion in 2014, and allocate 55% of capital spending for growth and return 45% to shareholders via buybacks and dividends.

– Barbara Kollmeyer

Topics: Investment Portfolio, markets, stock, Barbara Kollmeyer, Goldman Sachs

120514_WWBrock_1

Wendell W. Brock, MBA, ChFC

Subscribe by Email

Follow Me

Most Popular Posts

Other Sites I Follow, hobbies, fun and info:

gold-vs-silver-1.jpg  Nauvoo Mint brokerage services for precious metals


john Mauldin chair

Note:

Outside Economics is not a registered investment advisory firm (RIA) and does not act as an RIA. Outside Economics does not provide any specific investment advice. Any information obtained from this website or through one of  Outside Economics' representatives should be reviewed by a professional.

Subscribers Note: We do not sell our email list. Period. Thank you for subscribing.

Recent Posts